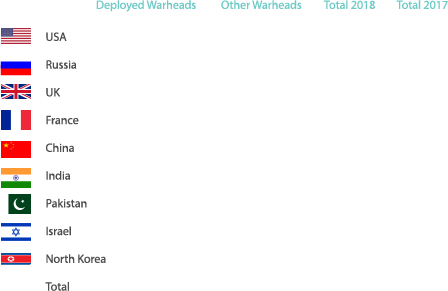
Nuclear weapons remain concentrated in ownership, decrease in total number
At the start of 2018, there were approximately 14,465 nuclear weapons in the world, concentrated in the hands of nine states - the US, Russia, the UK, France, China, India, Pakistan, Israel and North Korea. By contrast, The Stockholm International Peace Research Institute’s (SIPRI) data for the beginning of 2017 showed there were some 14,935 nuclear weapons globally. While the figures for North Korea are uncertain and are not included in total figures, and all estimates are approximate, it is still a notable decrease - particularly given that the total figures include the highest estimate when a range is given and actual totals may therefore be even lower.
World nuclear forces, January 2018

‘Deployed warheads’ refers to warheads placed on missiles or located on bases with operational forces.
‘Other warheads’ refers to stored or reserve warheads and retired warheads awaiting dismantlement.
The US and Russia dominate exports, the Middle East’s import share increases dramatically
International transfers of major weapons continued to rise, following the steadily upward trend that began in the early 2000s. By volume, such transfers rose by 10% between 2008–12 and 2013–17, reaching the highest level since the end of the Cold War. Dominating the supply side of these transfers in the 2013-17 period were the US, Russia, France, Germany and China; together they accounted for 74% of the total global volume of exports of major weapons.
China also found its way into the top five importers, alongside India, Saudi Arabia, Egypt and the United Arab Emirates; in total, these five countries made up 35% of total arms imports. Some 42% of the total global volume of imports of major weapons was directed to Asia and Oceania, making it the main recipient region, the Middle East followed with 32%. However, while Oceania and Asia’s share rose by just 1.8% between 2008–12 and 2013–17, the flow of arms to the Middle East grew by 103%. By contrast, the flow of arms to other major regions dropped notably, with Europe decreasing by 22%, the Americas by 29%, and Africa by 22%.
The main exporters and importers of major weapons, 2013-2017
Arms transfers continue to rise, approach $90bn mark for 2016
While SIPRI’s data on arms transfers does not represent their financial value, many of the countries that export arms publish figures denoting the financial value of these exports. Based off this date, SIPRI estimated the total value of the global arms trade in 2016 to have been at least $88.4bn.
The trend in transfers of major weapons, 1950-2017
Transparency sees little improvement, Arms Trade Treaty bears fruit
While the number of weapons being bought and sold continued to increase, there was little improvement in public transparency regarding these transfers in 2017. The number of states reporting their arms exports and imports to the United Nations Register of Conventional Arms dropped to an all-time low and no major changes occurred with respect to the various national and regional reporting mechanisms. However, most of the growing number of states that have ratified the 2013 Arms Trade Treaty have fulfilled their obligation of reporting arms exports and imports.
The number of submissions to the United Nations Register of Conventional Arms, 1992-2016
European Union implements majority of embargoes, extends beyond scope of UN
In 2017, 35 multilateral arms embargoes were in force: 13 imposed by the UN, 21 by the European Union (EU) and 1 by the League of Arab States. Of the EU’s embargoes, nine implemented UN arms embargoes directly, three were similar to UN embargoes but differed in geographical scope or the types of weapon covered, and nine had no UN counterpart.